Features SmartLSA
1.
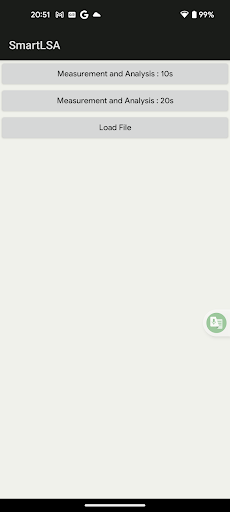
Measurement and Analysis (10 or 20 seconds) button starts measurement.
2.
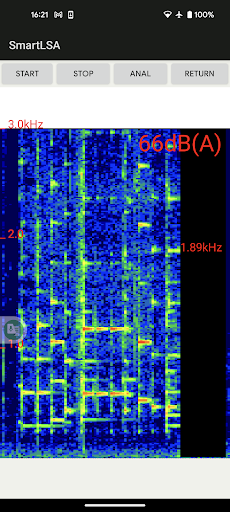
The acoustic image (spectrogram) screen (10 or 20 seconds) is displayed repeatedly in real time.
Tap the upper part of the screen to increase the display level.
And tap the lower part of the screen to decrease it.
During the measurement, the moving average sound pressure level (auditory correction value) and peak frequency for one second are displayed on the screen.
3.
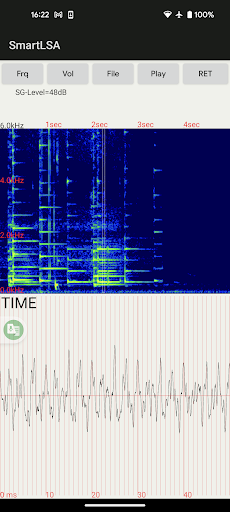
Pressing the ANAL button analyzes the data for the 10 or 20 seconds immediately before pressing the button, when it displays a spectrogram at the top of the screen for 5 seconds (tap the left or right edge of the screen to move the time axis) and a time waveform at the bottom of the screen.
The time axis waveform can be selected by tapping anywhere on the spectrogram displayed at the top of the screen, and the time width of the displayed interval can be freely expanded or contracted by pinching the analysis screen.
Various analyses such as FFT can be performed on this set interval.
4.
The analysis screen can be changed by pressing the following buttons.
TIME (waveform observation) → FFT (spectral analysis by FFT) → MEM (spectral analysis by MEM method).
5.
Pressing the Play button plays the measurement sound for the 5-second interval displayed on the screen.
6.
Data can be saved or deleted in the File menu.
To measure again, press the RET button to display the measurement screen, and then press the START button.
Music Features
Enjoy high-quality music streaming and playback features.
Gaming Features
Enjoy immersive gaming experience with various game modes.
Food & Dining
Discover recipes and order food from your favorite restaurants.
See the SmartLSA in Action
Get the App Today
Available for Android 8.0 and above